I-Grocery Analytics

This is a selection of screens (all actual data stripped for NDA reasons) from a 300+ hour project I spent consulting with the stakeholders of a UK-based grocery company to design these analytics dashboard that measure performance across areas of their business. With a multiplicity of filters, interactive elements and layers of information, this project was a massive undertaking. These new designs increased usability significantly so users could get to the insights they needed more efficiently, avoiding cost by wasting less time and creating clarity and ease on the user journey.

Client
UK-based grocery company (NDA)

Year
Designed in 2022

My Role
Lead UX designer+content architect+consultant

Results
-improved data navigation and user efficiency creating cost avoidance

-allowed users to get to data insights quicker to make more informed decisions and therefore profit the company

Global Filter Selection Screen: Here you can see the Home screen where users begin their journey through the data, making selections that filter the analytics they’ll see on the following screens. You can also see the custom icons I created to guide navigation in the left hand sidebar.

The process behind the designs: Here you can see the notes, content audit, sitemapping, wireframing, and iteration I worked through while consulting with this client to get to the final screen designs.

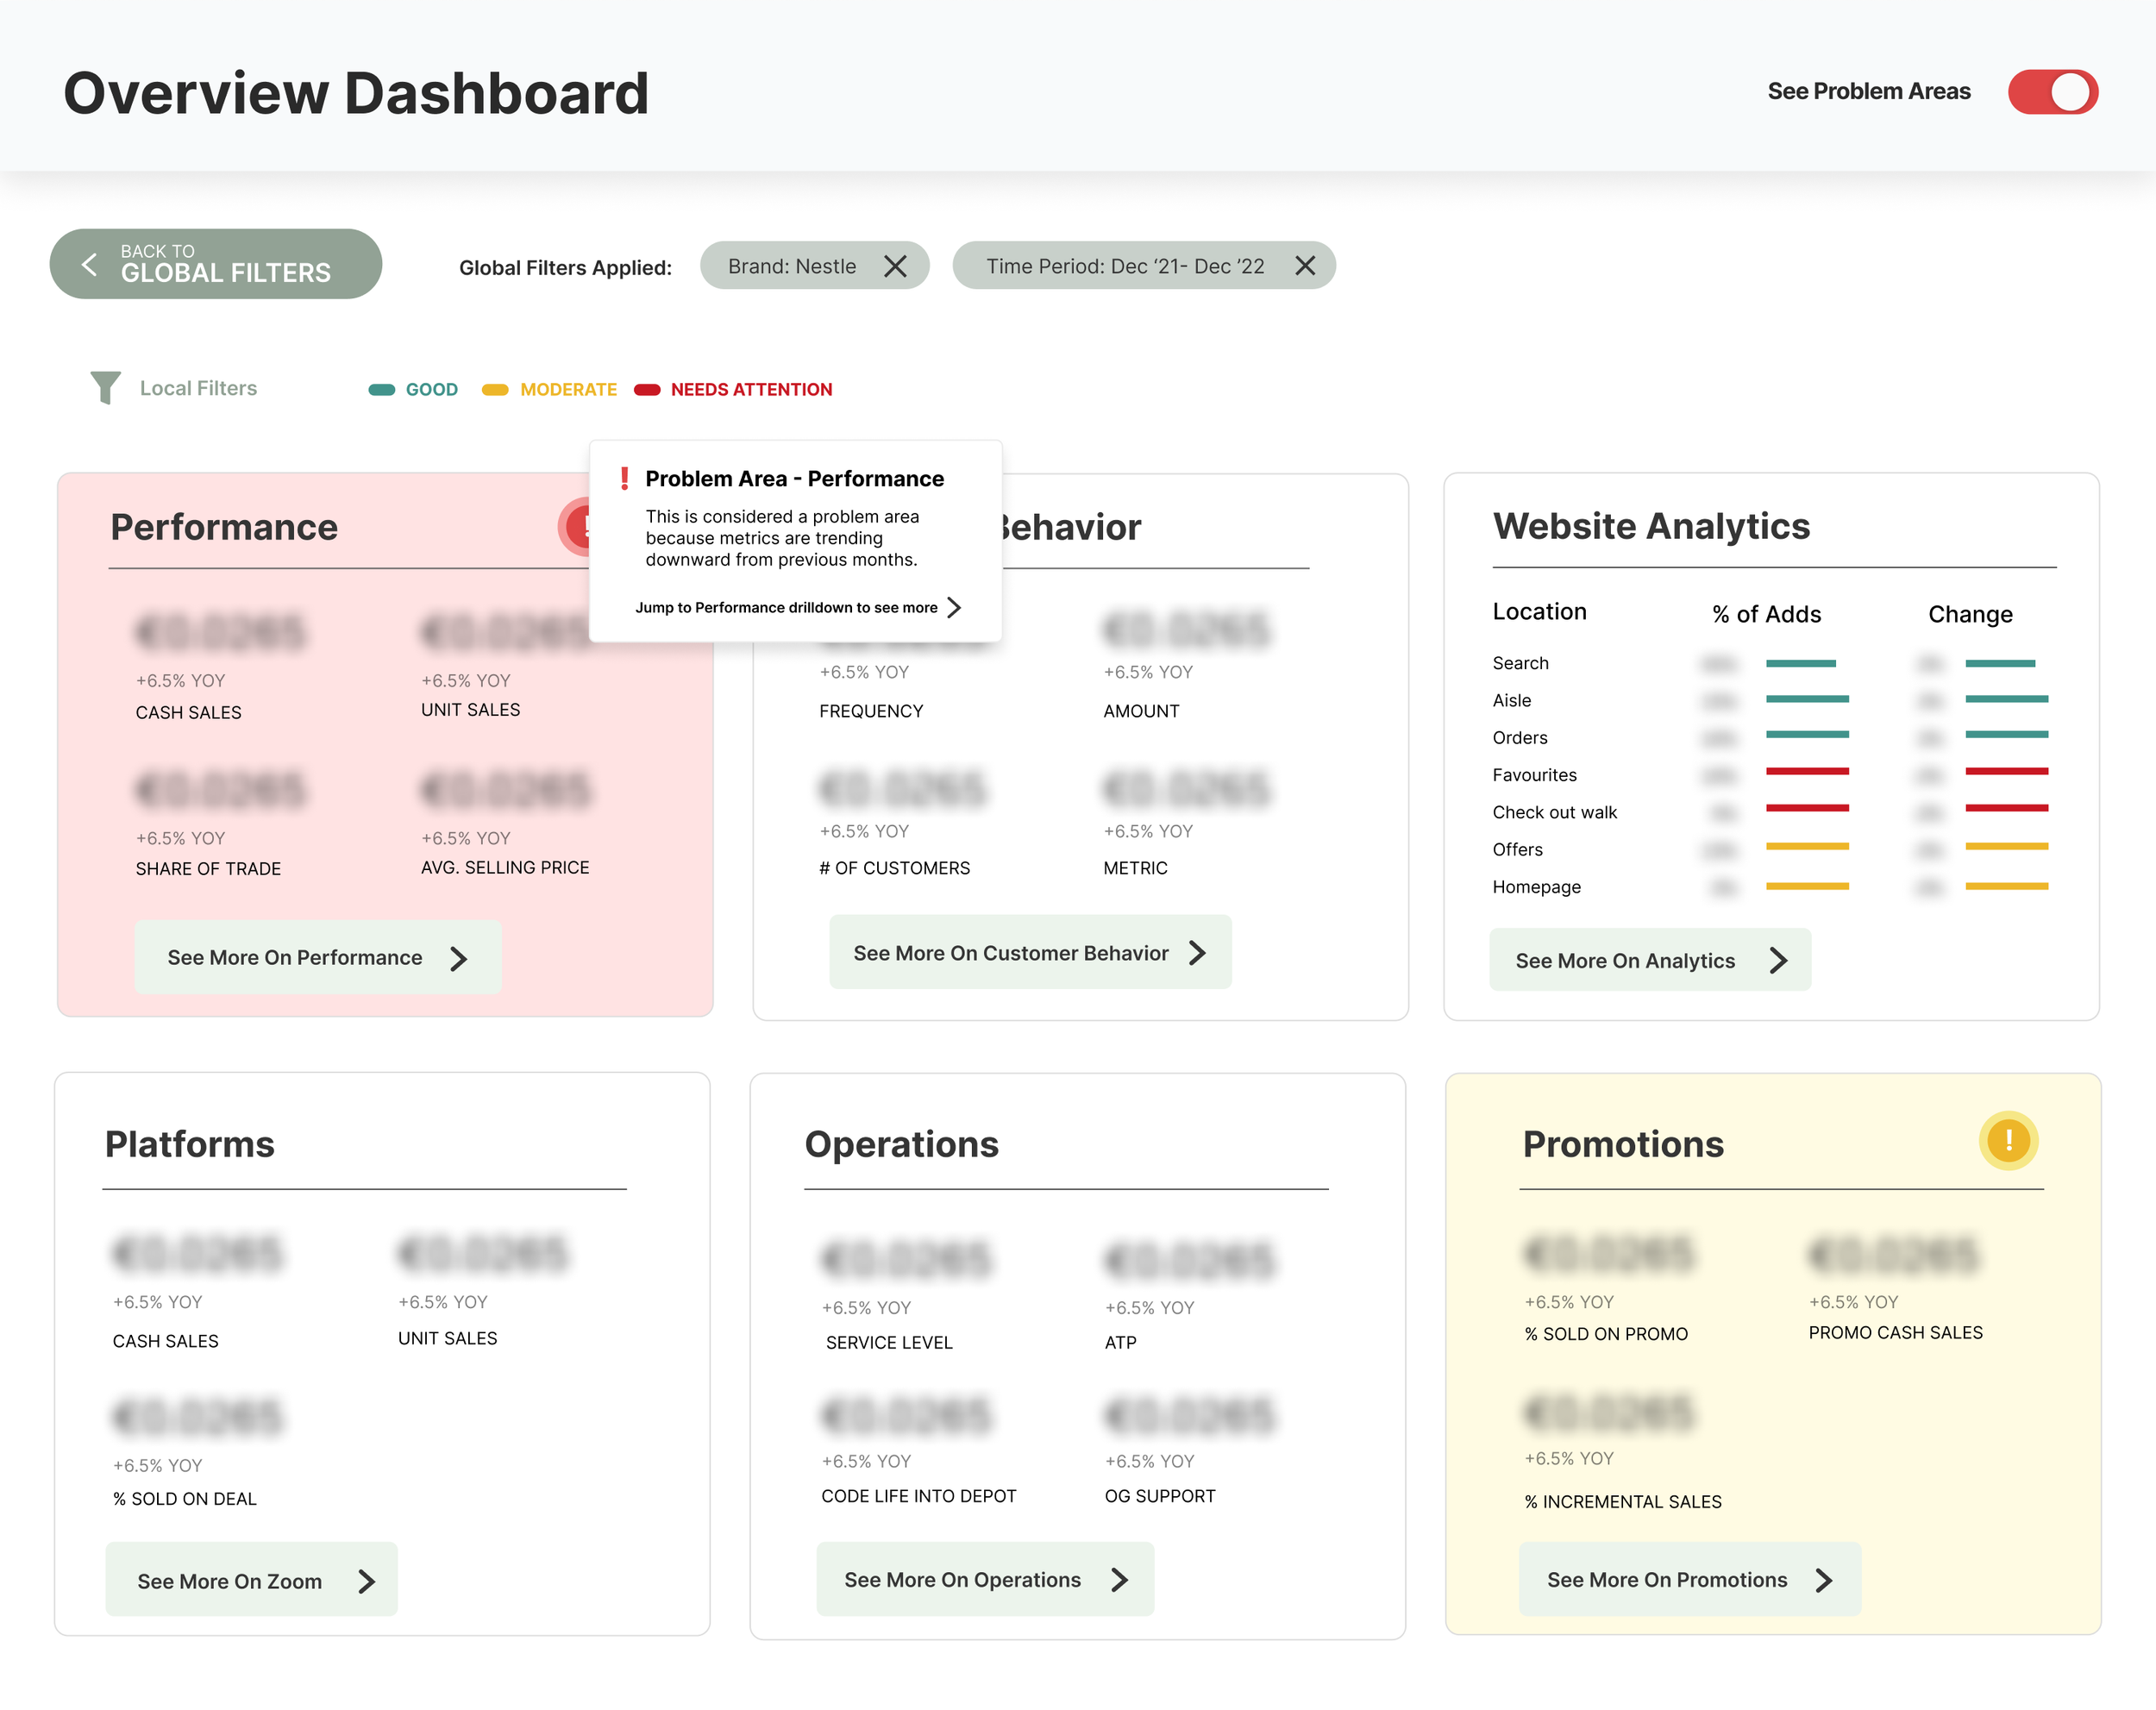
Overview: This overview screen is the second one users would see, after making selections on the home page that filters the data. This provides a high level view of how things are operating and what areas may need more immediate attention, so users can jump directly to those to save time. You can also see the navigation at the top, allowing users to jump back to the global filters home page or X out of filters they don’t want applied here.

Drilldown Dashboards: Here you can see the overview dashboard when the toggle “see problem areas” is turned on, and how thishighlights any prevalent issues. You can also see the Performance essentials and Market penetration dashboards, which have their own filters allowing users to choose between views and/or timeperiods they want displayed

Previous
Previous

Medefy Marketing+Print Designs

Next
Next

CRI-Help Branding